Forecasting Palarm's Financial Landscape in 2024: Strategic Revenue and Profit Scenarios
Palram Industries, a leading global manufacturer of advanced polymer solutions, has consistently delivered innovative products that serve various industries, including construction, agriculture, and advertising. With its headquarters in Israel and multiple production sites across continents, Palram specializes in producing high-quality polycarbonate and PVC sheets essential for various applications, ranging from greenhouse panels to digital print media. As a pioneer in the industry, Palram leverages cutting-edge technology and sustainable practices to meet the evolving needs of its global customer base while maintaining a solid commitment to environmental stewardship.
In the following review, I will examine various scenarios that could impact the pricing of Palram in 2024. I will explore five different scenarios describing their effects on the company's revenues and profit margins for 2024. Here are the scenarios:
🔗 This article is based on an Hebrew version.
- Scenario 1: A decrease in revenue to approximately 415 million ILS per quarter while maintaining profit margins.
- Scenario 2: A decrease in revenue to approximately 415 million ILS per quarter accompanied by a 1% improvement in net profit margin.
- Scenario 3: An increase in revenue to an average of approximately 440 million ILS per quarter, with a decrease in profit margins.
- Scenario 4: (Negative) A decrease in both revenue and profit margins.
- Scenario 5: (Positive) An increase in revenue accompanied by an improvement in profit margins.
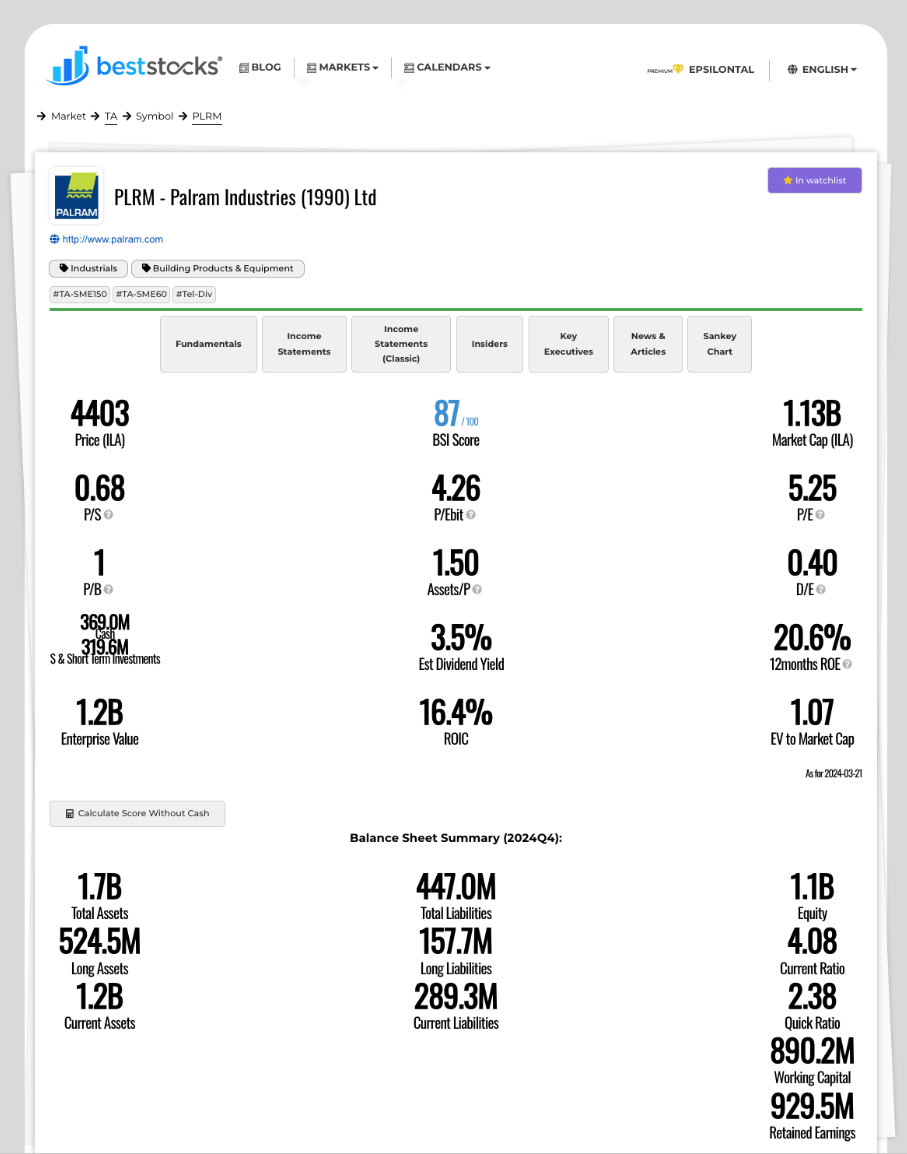
Scenario 1: Decrease in Revenue to Approximately 415 Million ILS per Quarter While Maintaining Profit Margins
In this scenario, let's assume Palram will decrease revenue to about 415 million ILS on average per quarter while maintaining an operational profit margin of 16% and a net profit margin of 13% following Q4 2023. In such a scenario, we would see a future PE ratio of about 5.2 at the end of 2024 for a company valued at 1.13 billion ILS (as of the reporting date), with about 370 million ILS in cash and short-term investments as of early 2024.
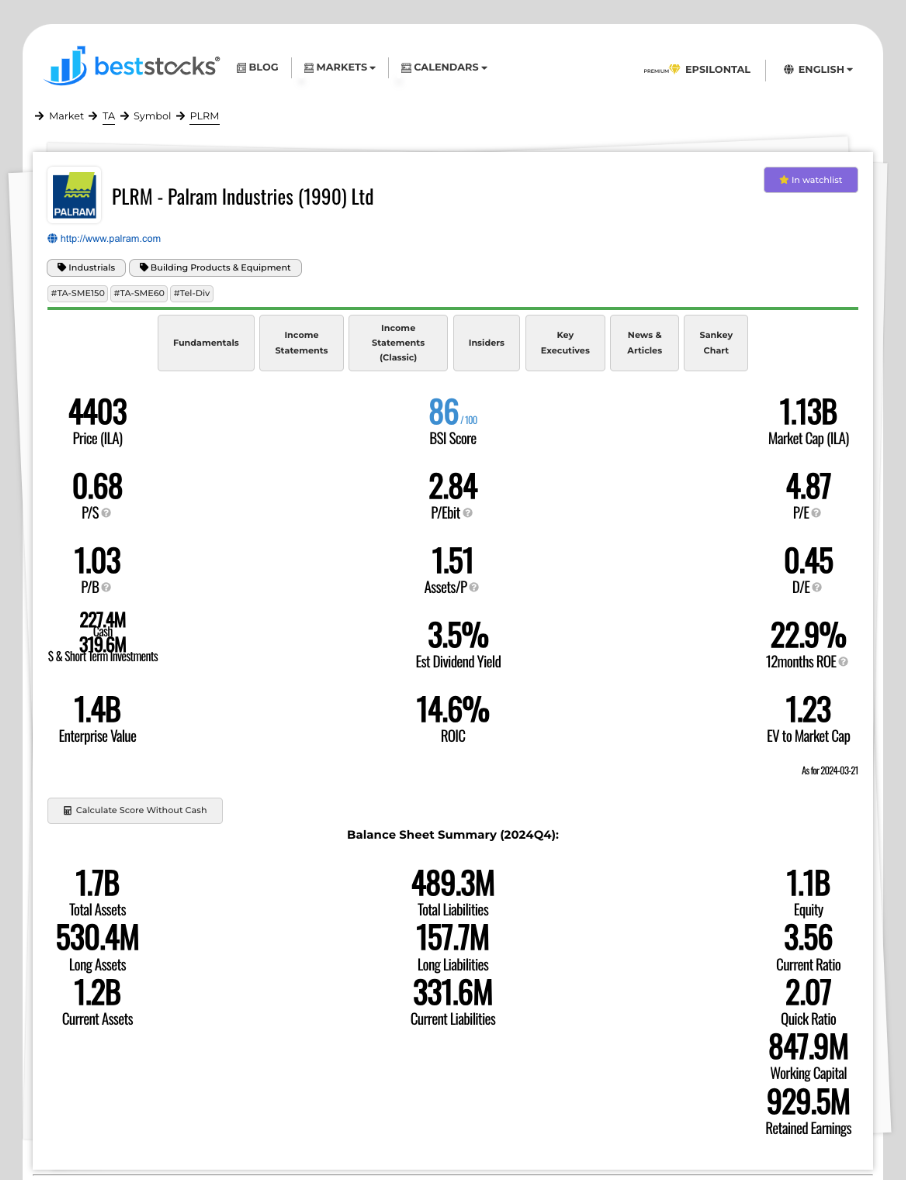
Scenario 2: Decrease in Revenue to Approximately 415 Million ILS per Quarter with a 1% Improvement in Net Profit Margin
In this scenario, we assume Palram benefits from improved margins thanks to reductions in raw material costs, shipping costs, and product mix changes, and we will analyze the impact of a 1% improvement in net profit. Thus, we project a net profit of 14% from 415 million ILS revenue (approximately 58 million ILS net profit per quarter). In an optimistic scenario where the company continues to streamline and improve its profit margins, we would see a future PE ratio (by the end of 2024) lower than 5 for a company valued at approximately 1.13 billion ILS (as of the reporting date), with about 370 million ILS in cash and short-term investments as of early 2024.
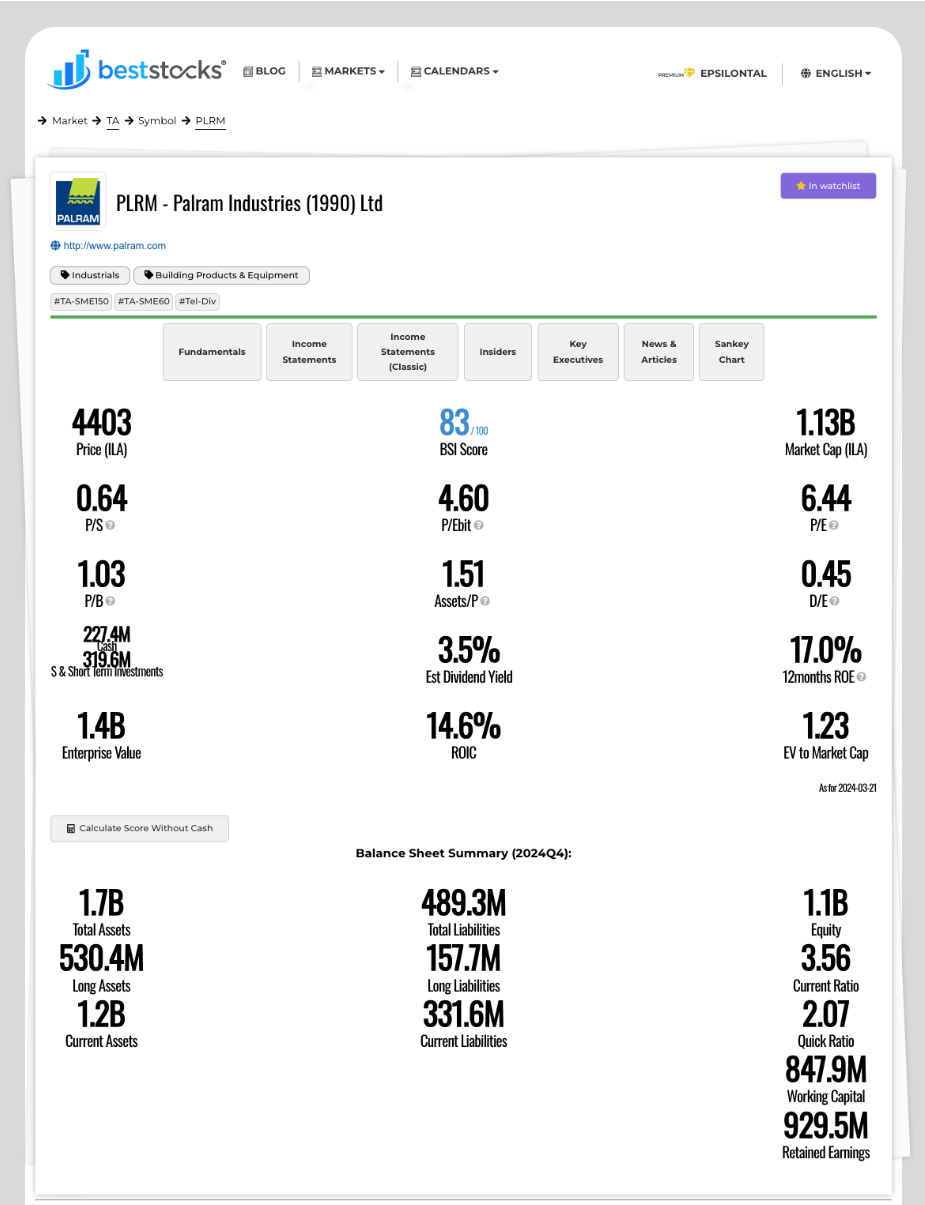
Scenario 3: Increase in Revenue to an Average of Approximately 440 Million ILS per Quarter, with a Decrease in Profit Margins
Approach: Economic growth and global demand for products lead to increased raw materials and shipping costs. In this scenario, we assume an increase in the cost of raw materials and shipping, leading to decreased profit margins. In contrast, demand for the company's products increases with revenue of approximately 440 million ILS per quarter. We assume a net profit margin of 10% and project a future earnings multiplier by the end of 2023 of about 6.4 for a company valued at approximately 1.13 billion ILS (as of the reporting date), with about 370 million ILS in cash and short-term investments as of early 2024.
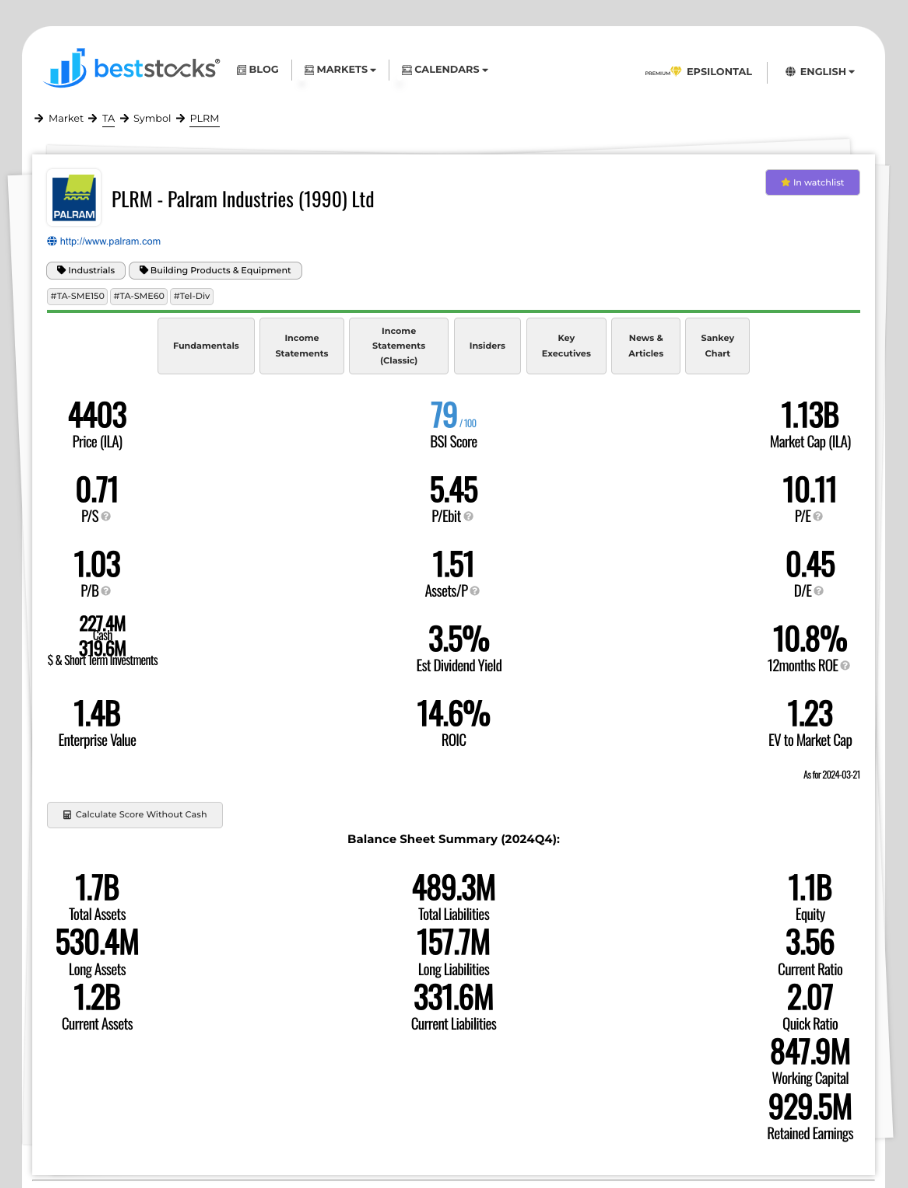
Scenario 4: (Negative) Decrease in Revenue and Profit Margins
For this scenario to occur, the company would suffer a decrease in revenue due to operational halts, reduced demand, entry of competitors, etc, while experiencing increased costs of raw materials and shipping and distribution. We assume a scenario where the company reduces its revenue to an average of about 400 million ILS per quarter while impacting the profit margin down to about 7% net profit per quarter (approximately 28 million ILS net profit per quarter). We would see a future PE ratio by the end of 2024 of about 10 for a company valued at approximately 1.13 billion ILS (as of the reporting date), with about 370 million ILS in cash and short-term investments as of early 2024.
Scenario 5: (Positive) Increase in Revenue Accompanied by an Improvement in Profit Margins
For this scenario to materialize, the company would need to benefit from a trend of increasing demand and/or expansion of activities due to acquisitions or penetration into new markets and geographies while reducing the cost of raw materials and shipping costs. We assume an average quarterly revenue of about 440 million ILS and a net profit margin of about 15% (similar to Q3 2020), reflecting approximately 66 million ILS net profit per quarter on average. We would see a future PE ratio of about 4.3 by the end of 2024 for a company valued at approximately 1.13 billion ILS (as of the reporting date), with about 370 million ILS in cash and short-term investments as of early 2024.
Disclosure: Writer owns shares, not a recommendation for action, may make changes at any time. Possible inaccuracies. This writing does not substitute for a review of the company's financial reports.